
“For those in the business of assessing, taking on and managing risk, the data available via the US Flood Map provides a much needed and significant step change in the ability to understand flood risk in the US,” suggests Dr Matthew Jones, Chief Product Officer at Fathom, a global leader in water risk intelligence.
 Speaking to Reinsurance News, Jones highlighted how flood risk is a significant and growing risk for most re/insurers.
He noted how the extreme flooding in Thailand in 2011 caused by Tropical Storm Nock-ten (~$20bn insured loss adjusted to current levels) served as “a wake-up call to the whole industry.”
Jones added that subsequent events, such as Hurricane Harvey in 2017 (>$10bn insured flood loss) and the July 2021 European floods (~$13bn insured loss), “only further demonstrated that flood risk is prevalent and widespread, and capable of producing multi-billion dollar event losses.”
Despite this, he suggested that today, most properties in the world are exposed to some form of flood risk, which is increasing due to urbanization and climate change.
In most countries, Jones said there is still a large protection gap. In the US, the proportion of homeowners with insurance for flood damage is somewhere in the region of 4%-15%, “leaving millions of homes at risk.”
Jones continued, “For the insurance industry, this insurance gap could be seen as a significant business opportunity, especially when coupled with changes to legislation supporting the privatization of flood insurance.
“The biggest obstacle to insurers capitalizing on this is the availability of comprehensive high-quality flood risk information. Without accurate data underpinning flood underwriting and pricing, it is easy to lose money on flood insurance.
“Despite best efforts, flood insurance has proved a significant challenge to the US – the National Flood Insurance Program’s (NFIP) debt levels (currently ~$20bn) demonstrate this. This is because flood is a notoriously difficult peril to model.
“The level of flood risk can vary within a few meters and it is present everywhere: so wide-scale, high-resolution models are required.”
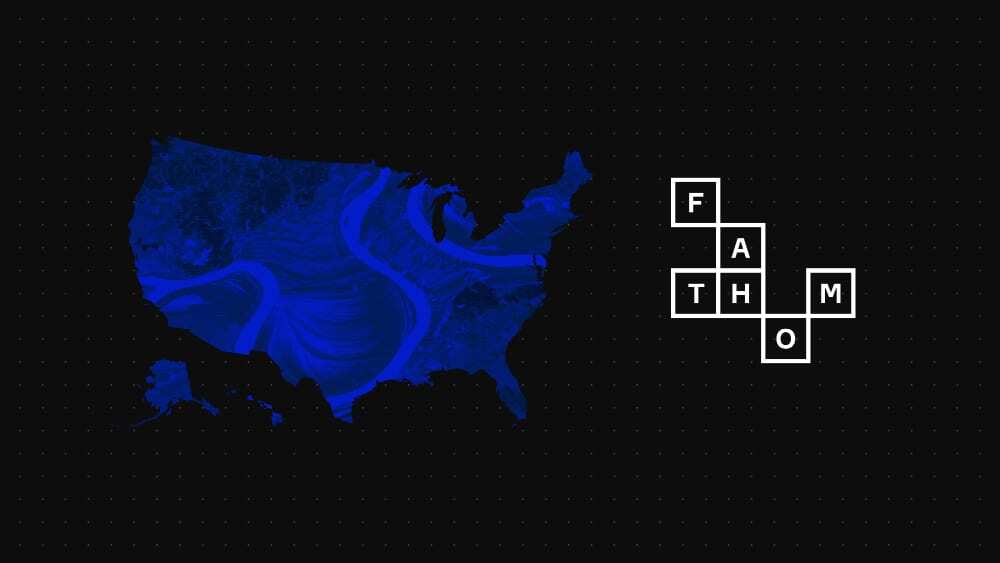
Overcoming this issue was the main reason Fathom was formed by two PhD students at the University of Bristol in 2013, Jones explained.
Fathom first produced a US flood map in 2016 and the recent update includes “some very significant advances.”
Outlining these, Jones said, “The main improvement is the huge quantity of high-quality elevation data included. Accurate land height information is a key component of flood models.
“LiDAR data is the gold standard here with centimetric accuracy, and the US leads the world in the quantity and availability of such data.
“However, gathering, quality controlling and blending this data into a coherent terrain map suitable for flood modeling is a significant and difficult task. In our new US Flood Map, we have compiled around 6.1 million km2 of LiDAR data, which represents 79% of land area and 94% of buildings within the conterminous US.
“This is unprecedented. In areas without LiDAR, we use our bare-earth terrain data – FABDEM – which was openly published in February 2022 and independently validated via peer-reviewed literature.”
Jones continued, “Our US Flood Map has many other important technical improvements, including sophisticated representation of river channel sizes, the influence of dams and up-to-date defense data. It covers the entire US for river, surface water and coastal flooding.
“By comparison, some estimates suggest FEMA maps cover only around one-third of rivers and streams. Our map also allows for a large variety of future climate options, all at a horizontal resolution of ~10m.
“This means that for those in the business of assessing, taking on and managing risk, the data available via the US Flood Map provides a much-needed and significant step change in the ability to understand flood risk in the US.”
He concluded, “The flood depths by return period and Risk Scores – showing the level of flood risk at a given location – within our US Flood Map can form an integral part of underwriting assessments, pricing tools and portfolio monitoring and management.
“Easily consumable via our API or Fathom Portal, these data will provide re/insurers with a competitive advantage in a market with significant growth opportunities, while at the same time helping reduce the protection gap.”